For the last couple years I have almost always had 5 to 10 active Personal Kanbans in Trello along with a folder in OneNote and another in Outlook or gmail (one for each PK). I have one of these trios for each client. I also have a trio for personal/home projects and another for church projects. I can access all 3 of these on my Mac, my windows laptop, and my Android phone. Sweet!
I'll generally work on one client or one project per day, or for a week, or even a month at a time. Whenever I finish for the day I endeavor to ensure my PK and notes pages are all up to date and in a state that will help me pick it back up tomorrow or some other day. Whenever I switch contexts, it's a simple matter to switch which Trello board and which OneNote folder I'm viewing.
I really like the way these work together. It's helping me become paperless which is a bonus given my travel and the number of notes I need to search for (and the sloppiness of my handwriting). This approach has segregated notes and tasks and emails into specific views so that I don't get distracted by what I don't need to focus on at the moment.
Seeing people take notes on a laptop, or open laptops in general, can be off-putting to many people. This is especially true when working with many different people or with a newish client, where we're still gaining trust and feeling each other out and haven't had many (or any) interactions yet. So I tend to take notes on paper whenever I'm having a conversation in person. Then I'll transcribe what is important of those notes into my PK or OneNote. Rewriting them (I'm told) helps to digest, consolidate, and remember what is important, a skill I never got the hang of in school. Many of my colleagues use those fancy pens to record handwriting and automatically convert it to text. I can see the benefit of that, but I'm a late adopter of new technology, due in part to being overly frugal. (I used a paper PK for a long while, until I found Trello.) I think I'll stick with manually reviewing and transposing the notes for a while.
All of this has gotten my life very organized. David Allen's Getting Things Done has helped too, but I've covered that in a prior post.
This may be the fastest blog post I've ever cranked out, one of the few I've cranked out in one sitting. I didn't know where the post was going to go until I wrote it. I just thought I'd share something about this system since it's been so powerful for me. I figured there was a blog post to be written about this, but I didn't/don't know what my readers would want to know.
What have I not covered that you'd want to know?

A blog about product development, product management, team and program management, lean, agile, and software development. Occasional posts about bicycling, Christianity, or racism.
Showing posts with label tools. Show all posts
Showing posts with label tools. Show all posts
October 16, 2015
July 24, 2012
Use Physical Story Cards
Sometimes you want to use an electronic Agile Application Life Cycle Management (ALM) tool for managing your user stories. There are benefits to using a tool. They have some really nice features, some of which can't be done in the physical realm. And sometimes you've just got to go electronic; you have no choice. But even if you've gone virtual, there are still benefits for having physical cards as well.
I recommend having a pre-planning meeting to help make iteration planning will go well. That first pre-planning before a team's first iteration planning meeting is particularly difficult. 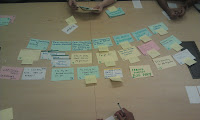 You don't know what your velocity is. You don't know how much you can get done. You may be unsure of dependencies. All this agile stuff is new. And you need to get several people to feel confident that the 1st sprint planning will go well. You have this large backlog of stories and you want to be sure everyone understands what we're sure we're putting in, what we're considering to put in, and what we're not putting in. So lay it out on the table. I love being able to slide cards around on a table and to be able to literally put something aside for now if it's giving us grief. It's not off the table, it's not out of sight, it doesn't look like it's still in the list, but it won't be forgotten. "Let's come back to THIS one later."
I've heard of other tools that make it easy to print, but I can't name them off hand. If you'd like to mention your tool in the comments, please do.
Lots could be written about keeping physical cards and an ALM tool in sync. I'm going to ignore keeping a Scrum card wall in sync in order to keep this post on the short-side, but I will add the following. If you are using physical cards for a prioritization or sizing exercise then just enter the updates back into the ALM tool and discard the cards -- or hang on to them for some other purpose if you want. The point is, the cards served their purpose, they are transient, update the tool and you are done. I could also approve of doing a story map at the start of a small release, then leave it on the wall as is as a historical vision document while the ALM tool becomes the plan of record. I also recommend sticking with physical cards through Iteration Zero and Iteration One. What's cool in I0 and I1 is using the same cards for socializing, estimating, prioritization, pre-planning, and finally planning and the daily standup, then seeing a gold star put on that sucker once it's done.
Bottom line: Keep using physical cards. I promise it will be worth it.
 | I like having my user stories on physical cards. Conversations are richer, and shorter, when you can point and ask "What's the difference between these two stories?" and the answer is "THIS story is about… but THAT story is for…". |
| Planning poker is great, but the Team Estimation approach is often better, especially if you have a dozen stories or more. I love it when someone can tell the team "I think THIS story is smaller than THAT one and larger than THIS one" and everyone immediately understand which stories he's talking about. |  |
 | Relative prioritization is easier when you can slide around some physical cards, especially if you need to prioritize collaboratively. "I'm okay with what we've laid out here, but if you think THAT story is THAT high a priority, you are nuts!" |
You don't know what your velocity is. You don't know how much you can get done. You may be unsure of dependencies. All this agile stuff is new. And you need to get several people to feel confident that the 1st sprint planning will go well. You have this large backlog of stories and you want to be sure everyone understands what we're sure we're putting in, what we're considering to put in, and what we're not putting in. So lay it out on the table. I love being able to slide cards around on a table and to be able to literally put something aside for now if it's giving us grief. It's not off the table, it's not out of sight, it doesn't look like it's still in the list, but it won't be forgotten. "Let's come back to THIS one later."  | Story mapping just has to be physical until we get inexpensive wall-size touch-screen monitors and story mapping software. |
| I've worked with clients that were very happy with their ALM tool and large monitors. I was impressed with their dedication to making agile work, their open space, and these monitors for each team. But as big as the monitors were, it still just seemed easier to me to manipulate and read fat sharpie on index card. And I can write SPLIT on a card faster than I can tag it as too big in an ALM tool. |  |
 | Sketches are interesting. A picture is worth a thousand words. Would be harder to do this on anything other than paper. |
| But using an ALM tool doesn't mean you can't have physical cards too. It's pretty easy to write the story title and estimate on an index card. You can write the story's ID number from the ALM tool on the card. You can also print story cards from some of the tools. VersionOne has always had a printing solution, but the version coming out in August 2012 will have the ability to print directly from the tool. |  |
I've heard of other tools that make it easy to print, but I can't name them off hand. If you'd like to mention your tool in the comments, please do.
Lots could be written about keeping physical cards and an ALM tool in sync. I'm going to ignore keeping a Scrum card wall in sync in order to keep this post on the short-side, but I will add the following. If you are using physical cards for a prioritization or sizing exercise then just enter the updates back into the ALM tool and discard the cards -- or hang on to them for some other purpose if you want. The point is, the cards served their purpose, they are transient, update the tool and you are done. I could also approve of doing a story map at the start of a small release, then leave it on the wall as is as a historical vision document while the ALM tool becomes the plan of record. I also recommend sticking with physical cards through Iteration Zero and Iteration One. What's cool in I0 and I1 is using the same cards for socializing, estimating, prioritization, pre-planning, and finally planning and the daily standup, then seeing a gold star put on that sucker once it's done.
Bottom line: Keep using physical cards. I promise it will be worth it.
November 10, 2010
Getting Started with Kanban - Answers for Some Mechanics

If you are reading this blog, you are probably not after Mechanical Agile. You are smarter than that. You want to add real value to your organization. You know that Kanban can help your team focus on flow and continuous improvement if you can figure out, in practical terms, how to use these metrics.
Let's say you've started well, with an understanding of what is important to your business and you have an improvement goal. Maybe you want to start measuring cycle time, want to have a Cumulative Flow Diagram and want to create a frequency distribution diagram or process control chart. You are getting started but the book leaves many details about how to do that as an exercise for the reader. Rightly so. You certainly wouldn't want a specific tool to be prescribed just as Kanban doesn't prescribe which improvement model to use, of which there are many: Deming, Lean, Theory of Constraints, etc.
Thinking back on some questions I had when I started using Kanban I realize many of them had nothing to do with improvement models. They were more basic. In hopes that this may help you, I provide some of the answers I've come across or come up with. I give credit for the good answers to conversations I've had with Dennis Stevens and others. The stupid answers are all mine.
After counting days blocked, do you exclude those blocked days from each item's duration?
No. What you are after with cycle time is how long on average it takes to pull something through the system. Blockage happens. It's part of the cycle. You want to know how long it will take to get an average story through the system with average blockage. You use the days blocked as another, separate metric available for analysis and improvement.
When something has been on hold for a long while and gets dumped, do you include that item in your average cycle time calculations?
Sometimes things get blocked so long that that you give up. Or should give up. Toss that effort in the trash. Forget about it. Write it off. Maybe it will come back again someday, but when it does, you might as well start over. Just dump it. Don't directly include that item in your average cycle time. I say don't "directly" include it because it has had an impact on the metrics. It took up time and effort and caused other items to be delivered later than they could have been. So that item had an impact on your cycle time even though you exclude that item from the metrics. If you were to consider the item's end date the date it got blocked and include that item in the average cycle time, this would make your cycle time look shorter than it really is. Conversely, you could skew your cycle time towards having too much buffer if you held onto the item too long and consider its end date the date you dumped it. So, no, don't include the item in your average cycle time.
Do you include weekends in your lead time calculation?
Eh, do whatever you want. If your average lead time is greater than a week and if your business thinks in terms of calendar time, include them. If your average lead time is around a week or less and if your business thinks in terms of business days, then exclude weekends. Excel has a networkingdays function you can use.
=NETWORKDAYS(B34,C34,'KanBan.xlsx'!holidays)

For quick items that start and end on the same day, should I count it as a day or as a half a day?
If your average cycle time is much greater than a day and this happens rarely, count it as a day. It's not worth the effort to do differently. If it's rare that any item takes 2 days to finish, then consider measuring at a granularity finer than a day -- measure in hours. If your average cycle time is a couple days and this happens often enough, count it as a half-day -- measure in half-day increments.
How do I graph a frequency distribution using excel?
Use a bar chart. I put the cycle time durations I care about in a column: .5, 1, 2, 3, 4, 5, 6, 7, 8, etc. These are the "bins" that feed the FREQUENCY formula. Name the binsRange and name the durationsRange. Next to those bins, is an array formula: select the range, type in the formula =FREQUENCY(durationsRange,binsRange), and press ctrl-shift-enter. Then I graph the bins and frequency as a bar chart as shown in the image at the top of this blog post.
How do I graph a Statistical Process Control Chart using excel?
I'm assuming you already have columns for completed date and duration. There must be a better way, but the quick and dirty approach is to add a column for the mean and upper and lower control limits and upper/lower spec limits. These columns will have the same value (the mean, or the mean plus/minus three standard deviations, or the spec limit) in all rows. Select those 5 or 7 columns: date, duration, mean, upper/lower control and upper/lower spec limit. Insert a X Y (scatter) chart. Select the mean series, right click, and Change Series Chart Type to a Line chart. Do the same for the other control lines. Voilà!
I hope this has been useful. If so, let me know.
What questions of this sort have you resolved or do you still have?
April 13, 2010
Printing Story Cards from VersionOne
VersionOne doesn't provide a direct way to print your stories on index cards, but it can be done. I'm going to tell you about the browser approach and the export approach. For the browser approach, getting set up to print your stories on index cards is a matter of figuring out what URL to hit to get just the stories you want to print. Then you can bookmark that URL for later reference and print the cards directly from the browser. The disadvantage is that it's a few steps to change your browser's print setup each time and you'll want to reset your browser's print settings afterward. But you can print on standard stock index cards if your printer will allow. I'll give you the details in a moment.
The export approach involves downloading Avery's print wizard and setting up a template. Then each time you want to print your stories, go to the view in V1 that has the stories and columns you want to see on cards. You'll then do a few steps to export the stories into a spreadsheet and use the Avery tool to format the stories (into another document) and then print them on special Avery stock. The advantage to this approach is being able to select which values you want on the card and where you want them. That's all I'm going to say about this approach.
The Browser Approach
To keep this from getting too complex, I'm going to describe what you need to do if VersionOne is hosting your instance. If you are hosting it yourself you should be able to figure out what to do by reading the original post.
Generally, we are going to get all the stories formatted as cards on a web page, then we're going to print from the browser onto cards. To see all of the stories in the system, use this URL:
For this and all the URLs below, you will need to replace "servername/v1instance" with your actual server and instance name. (Hint: look a the URL you use to access V1.)
Of course, you most likely will rarely want to print every story card. Thankfully, you can add some filtering. I'll provide some examples. You may have to do a little guessing, experimenting and URL manipulation, but I'll tell you how to approach that.
You can control which stories are returned by adding some query strings to your URL. For example, to see the stories for "Sprint #1", use the URL
Note the %23 in place of the hash symbol. You'll need to handle special characters in your URL appropriately.
To see the stories for "Iteration 7":
To see the stories for "Sprint #2" that are OPEN (64):
To see the stories for Iteration 6 that are OPEN (64):
To see the stories for Iteration 6 that are CLOSED (128):
You may want to do more filtering than in the examples here. To see what all the attributes and values are, leave the xslt out of the URL as follows:
There might be something useful to you in the Meta:
And you may need to refer to the Meta API and the ReST API documentation for V1's sdk as well as the article Getting Started with the API.
Now for Printing
Now that you have the stories you want to print formatted as story cards in your web browser, it's time to print them. This xslt we are using is set up to print two stories per page on letter size paper. If this is acceptable to you, you'll likely need to scale the print job to 80% or 90% when you print. Alternatively, you could go the extra mile and set up your browser to have no margins and no header or footer. But if you do that, you'll likely want to reset all of that once you are done printing.
That is certainly the easiest approach if you have a paper cutter handy, but with a little more effort we can print those directly onto stock index cards. To print those on a 3x5 card, set your browser as follows:
Question of the Day
Have you found any other approaches to print story cards from VersionOne?
The export approach involves downloading Avery's print wizard and setting up a template. Then each time you want to print your stories, go to the view in V1 that has the stories and columns you want to see on cards. You'll then do a few steps to export the stories into a spreadsheet and use the Avery tool to format the stories (into another document) and then print them on special Avery stock. The advantage to this approach is being able to select which values you want on the card and where you want them. That's all I'm going to say about this approach.
The Browser Approach
To keep this from getting too complex, I'm going to describe what you need to do if VersionOne is hosting your instance. If you are hosting it yourself you should be able to figure out what to do by reading the original post.
Generally, we are going to get all the stories formatted as cards on a web page, then we're going to print from the browser onto cards. To see all of the stories in the system, use this URL:
https://servername/v1instance/rest-1.v1/Data/Story?xsl=/s/custom/storyCards.xslFor this and all the URLs below, you will need to replace "servername/v1instance" with your actual server and instance name. (Hint: look a the URL you use to access V1.)
Of course, you most likely will rarely want to print every story card. Thankfully, you can add some filtering. I'll provide some examples. You may have to do a little guessing, experimenting and URL manipulation, but I'll tell you how to approach that.
You can control which stories are returned by adding some query strings to your URL. For example, to see the stories for "Sprint #1", use the URL
https://servername/v1instance/rest-1.v1/Data/Story?where=Scope.Name='Sprint %231'&xsl=/s/custom/storyCards.xslNote the %23 in place of the hash symbol. You'll need to handle special characters in your URL appropriately.
To see the stories for "Iteration 7":
https://servername/v1instance/rest-1.v1/Data/Story?where=Timebox.Name='Iteration 7'&xsl=/s/custom/storyCards.xslTo see the stories for "Sprint #2" that are OPEN (64):
https://servername/v1instance/rest-1.v1/Data/Story?where=Scope.Name='Sprint %232';AssetState='64'&xsl=/s/custom/storyCards.xslTo see the stories for Iteration 6 that are OPEN (64):
https://servername/v1instance/rest-1.v1/Data/Story?where=Timebox.Name='Iteration 6';AssetState='64'&xsl=/s/custom/storyCards.xslTo see the stories for Iteration 6 that are CLOSED (128):
https://servername/v1instance/rest-1.v1/Data/Story?where=Timebox.Name='Iteration 6';AssetState='128'&xsl=/s/custom/storyCards.xslYou may want to do more filtering than in the examples here. To see what all the attributes and values are, leave the xslt out of the URL as follows:
https://servername/v1instance/rest-1.v1/Data/StoryThere might be something useful to you in the Meta:
https://servername/v1instance/meta.v1And you may need to refer to the Meta API and the ReST API documentation for V1's sdk as well as the article Getting Started with the API.
Now for Printing
Now that you have the stories you want to print formatted as story cards in your web browser, it's time to print them. This xslt we are using is set up to print two stories per page on letter size paper. If this is acceptable to you, you'll likely need to scale the print job to 80% or 90% when you print. Alternatively, you could go the extra mile and set up your browser to have no margins and no header or footer. But if you do that, you'll likely want to reset all of that once you are done printing.
That is certainly the easiest approach if you have a paper cutter handy, but with a little more effort we can print those directly onto stock index cards. To print those on a 3x5 card, set your browser as follows:
- page setup: landscape, no margins, no header or footer
- print, properties, paper: 3x5
- print, properties, effects: leave set to actual size
- print preview: scale 50%
Question of the Day
Have you found any other approaches to print story cards from VersionOne?
Subscribe to:
Posts (Atom)